Supervised ML workflow for building a regression model on tabular data with categorical and continuous features.
Uses the tips dataset from seaborn, and trains several models to predict the tip amount. Uses scikit-learn for pre-processing, modeling, and evaluation.
This dataset contains no missing values, so imputation is not used.
This script does the following:
Splits data into train/test sets
Handles categorical and numerical features separately
Runs a grid search to find best model parameters for several models: linear regression, lasso, ridge, random forest regressor, knn regressor, xgboost regressor
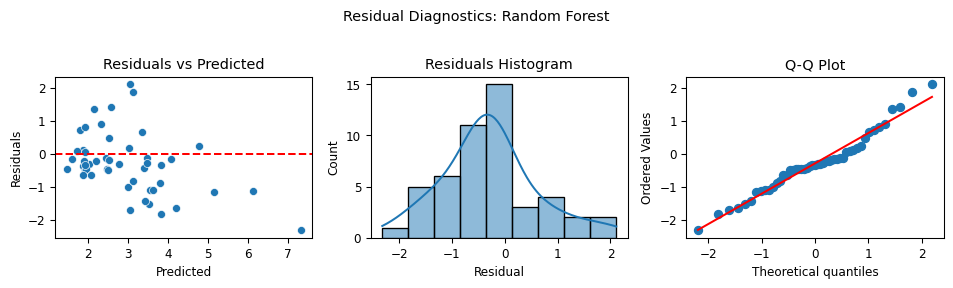
Evaluates results using RMSE, MAE, R² score to find the best model (Random Forest)
Creates 3 plots for evaluating residuals per model, and plots the evaluation for the best model
Predicts target on a fictional example using the best model
Note: Using display for HTML tables
print(summarize(df)) and print(df.head()) return tables printed in plain text. To get nicer-formatted HTML tables, use the following instead of print():
from IPython.display import displaydisplay(df.head())# Display summarydisplay(summarize(df))
Import and Check Data
import seaborn as snsimport pandas as pdfrom minieda import summarize # pip install git+https://github.com/dbolotov/minieda.gitimport timefrom pprint import pprintfrom sklearn.linear_model import LinearRegression, Lasso, Ridgefrom sklearn.ensemble import RandomForestRegressorfrom sklearn.neighbors import KNeighborsRegressorfrom xgboost import XGBRegressorfrom sklearn.model_selection import train_test_splitfrom sklearn.compose import ColumnTransformerfrom sklearn.preprocessing import OneHotEncoder, StandardScalerfrom sklearn.pipeline import Pipelinefrom sklearn.model_selection import GridSearchCVfrom sklearn.metrics import root_mean_squared_error, mean_absolute_error, r2_scorefrom scipy import statsimport matplotlib.pyplot as pltplt.rcParams.update({'font.size': 9}) # set global plot paramspd.set_option("display.width", 220) # set display width for printed tables# Load dataset and display first few rowsdf = sns.load_dataset("tips")print("\n----- First Few Rows of Data -----\n")print(df.head())# Display summaryprint("\n----- Data Summary -----\n")print(summarize(df))
----- First Few Rows of Data -----

   total_bill   tip     sex smoker  day    time  size
0       16.99  1.01  Female     No  Sun  Dinner     2
1       10.34  1.66    Male     No  Sun  Dinner     3
2       21.01  3.50    Male     No  Sun  Dinner     3
3       23.68  3.31    Male     No  Sun  Dinner     2
4       24.59  3.61  Female     No  Sun  Dinner     4

----- Data Summary -----

               dtype  count  unique  unique_perc  missing  missing_perc  zero  zero_perc     top freq   mean   std   min   50%    max  skew
total_bill   float64    244     229        93.85        0           0.0     0        0.0               19.79   8.9  3.07  17.8  50.81  1.13
tip          float64    244     123        50.41        0           0.0     0        0.0                 3.0  1.38   1.0   2.9   10.0  1.47
size           int64    244       6         2.46        0           0.0     0        0.0                2.57  0.95   1.0   2.0    6.0  1.45
sex         category    244       2         0.82        0           0.0     0        0.0    Male  157
smoker      category    244       2         0.82        0           0.0     0        0.0      No  151
day         category    244       4         1.64        0           0.0     0        0.0     Sat   87
time        category    244       2         0.82        0           0.0     0        0.0  Dinner  176
Transform Data
# Define columnscat_cols = ['sex', 'smoker', 'day', 'time']num_cols = ['total_bill', 'size']# Split the dataX = df[cat_cols + num_cols]y = df['tip']# Split into training and testX_train, X_test, y_train, y_test = train_test_split( X, y, test_size=0.2, random_state=42)# Define preprocessing for numeric and categorical featuresnumeric_preprocessing = Pipeline([ ('scale', StandardScaler())])categorical_preprocessing = Pipeline([ ('encode', OneHotEncoder(drop='first', sparse_output=False)) # one-hot; drop first feature to avoid multicollinearity])# Combine into a column transformerpreprocessor = ColumnTransformer([ ('num', numeric_preprocessing, num_cols), ('cat', categorical_preprocessing, cat_cols)])
Build Models - Linear Regression, Ridge, Lasso, Random Forest, k-NN, XGBoost